News
Site Editor
 Site
/uploads/5cb96e23627a5.png
From January to April 2019, China's plastic machinery industry described a total of 447, including 109 loss-making enterprises, with a loss of nearly 1/4, which was greater than the loss of 20.68% in the same period of last year; the loss was 115 million yuan (RMB) was higher than the loss of RMB 94 million in the same period last year.
Briefing on the Status of China's Plastic Machinery Industry From Jan to Apr 2019
Views: 1162
Author: Site Editor
Publish Time: 2019-08-16
Origin: Site
From January to April 2019, China's plastic machinery industry described a total of 447, including 109 loss-making enterprises, with a loss of nearly 1/4, which was greater than the loss of 20.68% in the same period of last year; the loss was 115 million yuan (RMB) was higher than the loss of RMB 94 million in the same period last year.
From January to April, the cumulative output was 75,253 units, down 23.55% year-on-year; the export delivery value was 2.9 billion yuan, up 6% year-on-year; the total profit was 1.621 billion yuan, down 27% year-on-year; the operating income margin was 7.92%, increase of 5.39% than the average level of the national machinery industry in the same period, Among them, the output in April was 20,669 units, down 36.32% year-on-year; the export delivery value was 752 million yuan, up 15% year-on-year; the total profit was 337 million yuan, down 58% year-on-year.
China's plastic products output in January-April was 21.31% lower than the same period last year.
According to corporate statistics in April: From January to April, the output of plastic products of industrial enterprises above designated size was 18.528 million tons, an increase of 0.7% year-on-year; among them, the output in April was 4.893 million tons, down 3.9% year-on-year. According to monthly corporate statistics: From January to April, the total output of plastic products of the above-mentioned industrial enterprises in China was 19.867 million tons, down 21.31% year-on-year; among them, the output in April was 4.893 million tons, down 9.46% from the previous month and down 4.34% year-on-year.
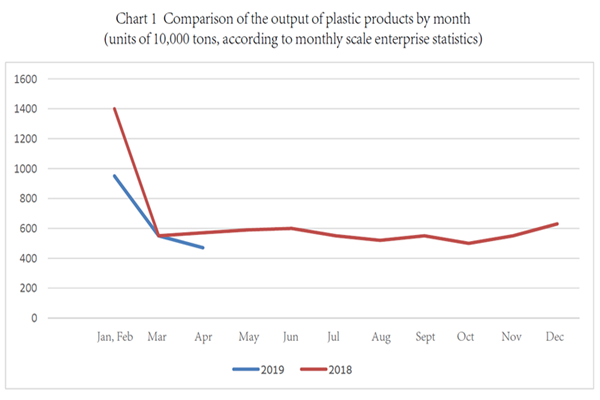
From January to April, the total output of the top five plastic products (Guangdong, Zhejiang, Fujian, Jiangsu and Hubei) reached 9.702 million tons, accounting for 52.4% of the country's total output. (According to the scale of enterprise statistics in April)
Chart 2 China's plastic products output by region in April 2019 (Unit: 10,000 tons)
area | Apr output | Jan-Apr output | area | Apr output | Jan-Apr output |
Guangdong | 79.77 | 293.83 | Shanxi | 7.49 | 28.72 |
Zhejiang | 68.32 | 259.88 | Liaoning | 8.5 | 27.21 |
Fujian | 39.13 | 154.66 | Jiangxi | 5.87 | 26.46 |
Jiangsu | 36.51 | 134.12 | Tianjin | 7.7 | 25.59 |
Hubei | 32.66 | 127.53 | Guangxi | 6.66 | 24.77 |
Anhui | 34.32 | 127.41 | Yunnan | 4.11 | 17.15 |
Sichuan | 29.61 | 120.1 | Beijing | 1.99 | 7.63 |
Henan | 25.01 | 114.99 | Jilin | 1.56 | 5.51 |
Shandong | 17.6 | 67.22 | Gansu | 1.5 | 4.55 |
Shanghai | 14.44 | 51.74 | Shanxi | 1.24 | 4.52 |
Hebei | 14.46 | 49.38 | Heilongjiang | 1.34 | 3.31 |
Guizhou | 12.65 | 47.89 | Ningxia | 1.17 | 3.28 |
Chongqing | 13.45 | 47.66 | Neimenggu | 0.48 | 1.49 |
Hunan | 13.74 | 42.9 | Hainan | 0.14 | 0.89 |
Xinjiang | 7.62 | 31.86 | Qinghai | 0.17 | 0.5 |
|
|
| Xizang | 0.03 | 0.08 |


